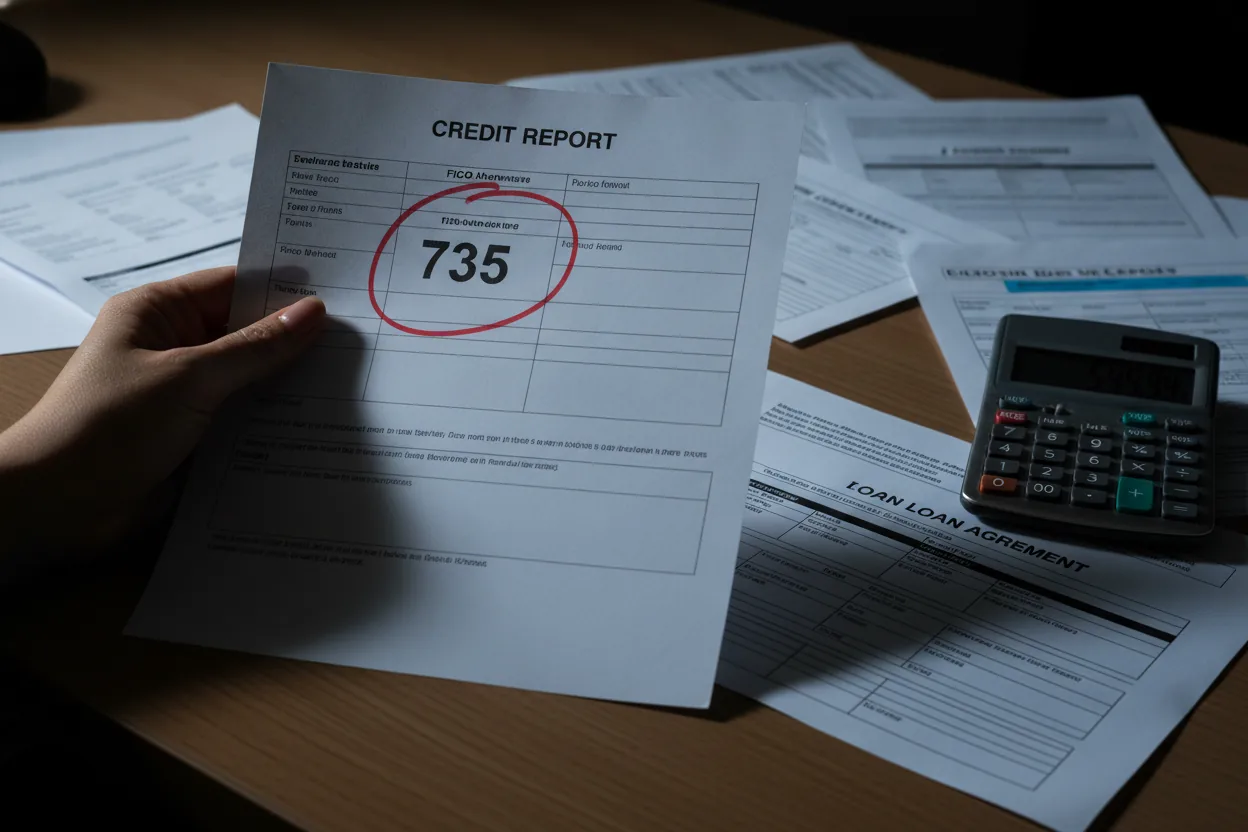
Estimates suggest that a $35,000 car loan could cost thousands more over 60 months if your FICO score lands on the wrong side of an invisible line, and Fair Isaac has never published where that line actually sits. Lenders get full transparency into the model's predictive logic. Borrowers get a five-category summary that researchers using machine learning have found to be a significant oversimplification of how the score actually behaves. That gap isn't a communication failure. It's the architecture of the product, and understanding what the algorithm actually rewards is the only way to stop paying for not knowing.
Researchers using machine learning have started pulling that curtain back. By feeding large synthetic and anonymized credit datasets into gradient boosted models and interpretability frameworks like SHAP, analysts can reconstruct which input variables drive score movement and by approximately how much. The findings don't always match the simplified five-category breakdown Fair Isaac publishes on its consumer education pages. Where the official narrative and the reverse-engineered behavior diverge is where the real design intent becomes visible.
What Fair Isaac Says Versus What the FICO 8 Model Actually Weights
Fair Isaac's public documentation describes FICO 8 as weighting five factors: payment history at 35%, amounts owed at 30%, length of credit history at 15%, new credit at 10%, and credit mix at 10%. Rounded percentages. Digestible. Almost certainly an oversimplification of what is actually a nonlinear scoring function with dozens of internal variables, conditional branches, and interaction effects that these top-line percentages do nothing to capture.
When researchers apply SHAP values to reconstructed models trained on credit bureau data, the picture shifts considerably. Utilization sits inside amounts owed, and it doesn't behave linearly. The penalty for crossing certain thresholds, commonly observed around 30% and again near 70% per individual tradeline, appears disproportionately steep relative to the smooth curve the public documentation implies. This is consistent with observed market behavior: borrowers who pay down a card from 75% to 29% utilization report score jumps that wouldn't be proportional under a simple linear model. The score treats threshold crossings as categorical events, not incremental ones.
FICO 8 Official Five-Factor Weight Breakdown
FICO 8 Official Five-Factor Weight Breakdown
How Fair Isaac says the score is calculated (totals 100%)
Source: Fair Isaac public documentation
Source: Fair Isaac public documentation
Payment history carries the largest stated weight, but ML research suggests the recency weighting within that category is severe. A single 30-day late payment within the past 12 months appears to produce score damage far larger than the 35% headline weight would arithmetically suggest, particularly for borrowers with otherwise thin files. The model punishes recent delinquency as though it predicts imminent default, which from a lender's actuarial perspective it arguably does. From the borrower's perspective, a medical billing error that aged into collections and was later resolved can still suppress borrowing costs for years. The score reflects lender risk preference, not consumer financial behavior in any holistic sense.
The credit mix category, officially 10%, appears to interact with length of history in ways the flat percentage misrepresents. Reverse-engineering work suggests that the absence of installment loan history in a profile otherwise loaded with revolving accounts creates a heavier penalty than 10% would imply, particularly when the file is under a decade old. This is a structural nudge toward taking on certain product types, specifically the kinds of products banks and auto lenders originate. The design rewards a particular consumption pattern. Borrowers who never financed a car or carried a personal loan get penalized for a behavior gap the published documentation barely acknowledges, and lenders benefit from a scoring architecture that steers consumers toward the exact products they originate. Disciplined, debt-light financial lives are quietly taxed for not fitting the mold.

Building a Shadow Model: How Researchers Reverse Engineer FICO Scoring
The methodology behind FICO reverse engineering isn't speculative. It follows a reproducible pipeline that academic and independent researchers have been refining since at least the early 2020s. The core approach treats FICO 8 as a black box and attempts to approximate its decision boundary using observable inputs and outputs.
Official Weight vs. ML-Reconstructed Behavior by FICO 8 Factor
Official Weight vs. ML-Reconstructed Behavior by FICO 8 Factor
Where the published narrative diverges from observed scoring behavior
| Factor | Official Weight | ML-Observed Behavior |
|---|---|---|
| Payment History | 35% | Recency weighting is severe. One 30-day late within 12 months causes damage far beyond 35% arithmetic share. |
| Amounts Owed | 30% | Utilization is nonlinear. Threshold crossings near 30% and 70% per tradeline trigger steep, categorical score drops. |
| Length of History | 15% | Interacts with credit mix. Files under 10 years old with no installment history face compounded penalties. |
| New Credit | 10% | Penalizes thin files more heavily for recent inquiries. Interaction with file age amplifies stated weight. |
| Credit Mix | 10% | Absence of installment loans in revolving-only profiles carries a heavier penalty than 10% implies; steers borrowers toward bank products. |
Source: Fair Isaac documentation vs. ML reverse-engineering research using SHAP values
Source: Fair Isaac documentation vs. ML reverse-engineering research using SHAP values
The process runs in three phases. Researchers first construct or obtain a dataset where individual credit attributes are known alongside corresponding FICO scores. A flexible model, usually XGBoost or a neural network, is then trained to predict the FICO score from those attributes. Then interpretability tools decompose the predictions into per-feature contributions. The resulting SHAP plots show not just which variables matter but how the marginal contribution of each variable changes across its range. That's where the nonlinearities become visible.
The practical limitation is data access. Fair Isaac scores are generated by Equifax, Experian, and TransUnion using bureau data under license. Researchers working outside institutional settings typically use synthetic datasets, self-reported score tracking data aggregated from platforms like Credit Karma or Experian Boost, or academic datasets released under restricted terms. The shadow models approximate FICO 8 behavior rather than replicate it with certainty, and researchers are explicit about this. The question being answered isn't what the exact formula is, but whether the published explanation is sufficient to describe how the model actually behaves. The evidence consistently says it isn't.
The broader implication is about information architecture. Lenders using FICO 8 have full transparency into the score's predictive validity through their own portfolio performance data. Fair Isaac maintains that relationship with institutional clients directly. The consumer, whose financial life is being scored, receives a simplified categorical explanation and a suggested improvement action that may or may not reflect the actual weighting logic. That's not an accident of poor communication. It's a structural feature of how the product is sold, and the institutional client paying for the score is not the person the score describes.
Utilization Threshold Crossings as Categorical Score Events
Utilization Threshold Crossings as Categorical Score Events
FICO 8 treats these bands as distinct states, not a smooth curve, per tradeline
Source: ML reverse-engineering research on FICO 8 nonlinear utilization scoring
Source: ML reverse-engineering research on FICO 8 nonlinear utilization scoring
Why FICO Opacity Costs Borrowers More Than They Realize
Think about what a borrower actually needs to optimize their score. If utilization thresholds are step functions rather than gradual slopes, timing a credit card paydown to land just below 30% on the reporting date matters more than carrying a slightly lower average balance. That operational detail, reported widely by credit practitioners on forums and aggregated from score tracking apps, doesn't appear anywhere in Fair Isaac's official consumer guidance. The gap between knowing the category and knowing the mechanism translates directly into borrowing cost.

Inquiries are a documented case of this. FICO 8 is designed to treat multiple mortgage or auto loan inquiries within a short window as a single inquiry for scoring purposes, recognizing that rate shopping is rational consumer behavior rather than a credit risk signal. That window is generally 45 days. What isn't well publicized: this deduplication applies specifically to coded inquiry types from mortgage and auto lenders. A consumer rate shopping personal loans or credit cards doesn't get the same treatment. The mechanism differs by product category. Borrowers unaware of this distinction take unnecessary score hits while shopping for consumer credit products at the exact moment their borrowing costs are being determined.
The scale of this cost aggregates quickly. Roughly 200 million Americans have scoreable FICO files. A meaningful share of borrowers operating near score tier boundaries pay a higher rate than they would with better mechanical knowledge. The total transferred cost across the consumer credit system, calculated from the spread between credit tier pricing and the population distribution of scores near tier thresholds, runs into the billions annually. The mechanism is clear even where a precise dollar figure isn't.
Relative Score Penalty by Credit Card Utilization Rate
Relative Score Penalty by Credit Card Utilization Rate
Higher bars indicate greater score damage. Penalty is nonlinear across thresholds.
Source: ML reverse-engineering research using SHAP values on FICO 8 behavior
Source: ML reverse-engineering research using SHAP values on FICO 8 behavior
FICO 8 was not designed to help borrowers understand their creditworthiness. It was designed to give lenders a standardized, legally defensible prediction of default probability. Those are different objectives that happen to use the same number. Machine learning researchers who reverse engineer the model aren't attacking Fair Isaac. They're building an external translation layer for the people who can't afford not to understand it. The opacity serves lenders. The translation serves everyone else. And the fact that it takes a machine learning pipeline to access basic mechanical truth tells you exactly who this system was built for.
This article is for informational and educational purposes only and does not constitute financial, investment, or legal advice. The views expressed are analytical observations and should not be relied upon for personal financial decisions. Always consult a qualified financial advisor before making investment decisions.
Impermanent Loss: What DeFi Liquidity Pools Actually Cost You